

Whisky comes with much history, folklore and personal tastes, but it is also big business that thrives as a premium product made with high quality methods. Liquid sunshine is also complex chemistry. The manufacturing process is deep science with a dash of art, which requires high skill to create perfectly balanced flavours and odours, but also sets up the incentive and possibility for fraud and adulteration.
Oxford Indices’ background is in advanced data origination and analytics, primarily in the automotive, food and beverage markets. Across these diverse markets, the power of the latest methods in analytical chemistry can illuminate the mix of organic chemical compounds present, whether that is in a vehicle exhaust or manuka honey. The nature and size of the sector has enticed Oxford Indices to set about understanding the increasingly diverse and global range of whiskies.
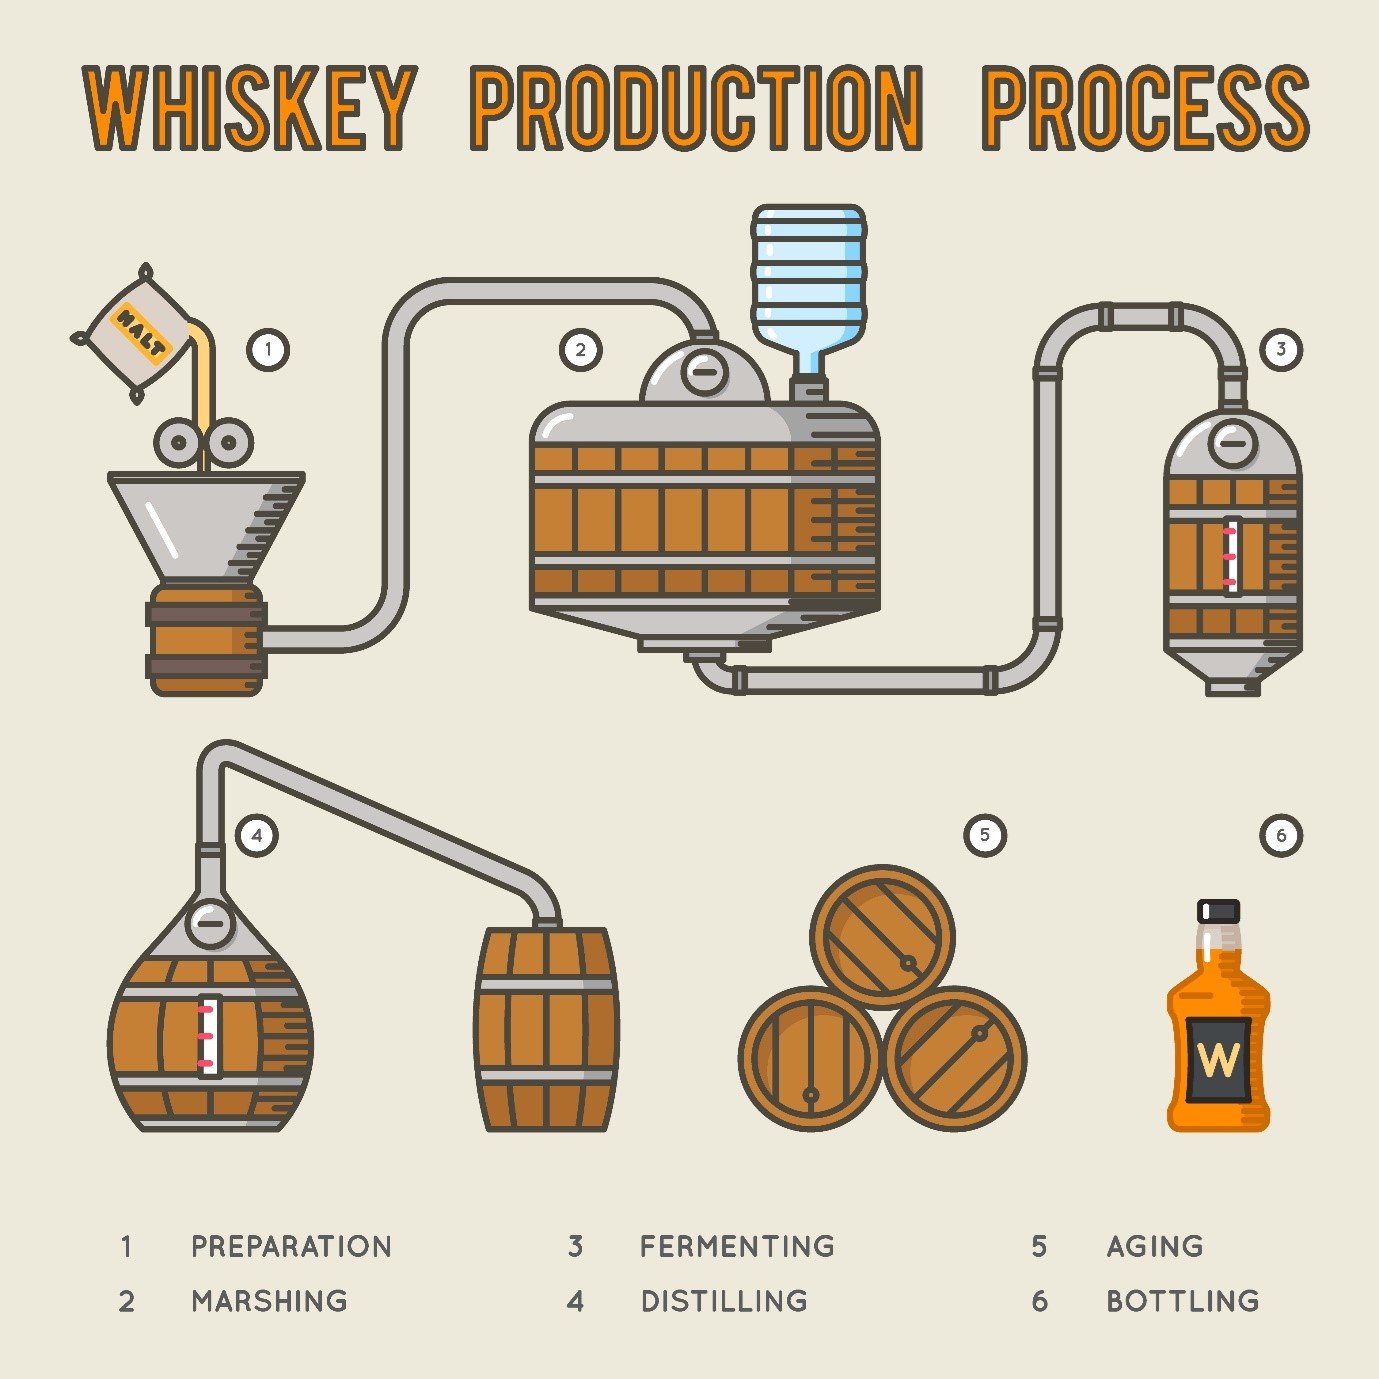
A whisky is made up primarily of organic compounds – those containing some combination of carbon atoms and most often hydrogen atoms – of which there can easily be 50 or more in an individual product. These compounds define the flavour and strength of the whisky but can also bring undesirable health effects or other characteristics. The most common classes of compounds include lactones, phenolics, aldehydes and esters, which arise from the various stages of the production process shown below.
As each whisky has its own unique combination of compounds, we tested 50 different products, covering 36 different single malts and 14 blends, drawn from around the world. Each was sampled from recently opened bottles stored in controlled conditions, and then analysed in our laboratory using liquid injection into a two-dimensional gas chromatography and time-of-flight mass spectrometry system from Markes International and SepSolve Analytical.
The benefit of this analytical approach is that the two dimensions of the chromatography allow for near-complete separation of all the organic compounds, in a way not possible with standard one-dimensional separation, which is limited by coeluting peaks on the chromatogram. The time-of-flight mass spectrometry allows for powerful identification of the separated compounds even using standard spectral libraries. With a sensitivity down to parts-per-billion, trace amounts of compounds can be discovered effectively by this approach.
Taking a specific example, of the Kavalan single malt whisky from Taiwan, we can see below that, grouping the compounds for generic functional groups, unsurprisingly the overwhelmingly most abundant compounds are alcohols. The measure of ‘peak area %’ refers to the area under the peaks on a chromatogram, as a fraction of the sum of the areas under all the peaks. While not exactly a measure of concentration, it is a good measure of relative abundance.

The alcohol group is dominated by ethanol, with 1-butanol‚ 3-methyl- in fact being more prevalent, along with lower concentration compounds such as 1‚3-butanediol and 1-octanol. While some flavourings arise from these alcohols, the greater complexity comes from the long tail of low concentrations compounds in the other groups, including lactones, phenols, aldehydes and furans, that can be picked up by the sensitive human palate.
Drilling into more detail with Kavalan, the table below takes the ten flavour compounds with the lowest abundance in the sample. The average peak area of these is just 0.019% of the total, which demonstrates the ability of this technique to see very low concentrations. Moreover, when testing multiple samples, a high degree of repeatability is achieved. Despite the low concentrations, it is possible to see the complexity and nuance that are created by the fermentation, distillation and ageing processes.

At the same time, it is also possible to identify less desirable compounds in the final whisky product. This can be used to pinpoint contamination or adulteration, but also chemicals that are intermediate compounds that do not contribute to the ultimate flavour and may even be undesirable. Across all the whiskies tested, compounds in this category include pentaethylene glycol, acetic acid, nitro-, methyl ester and α-toluenethiol – all of which can be irritants to the skin, eyes and lungs if present at relatively high concentrations.
A corollary of being able to identify this range of compounds is that we can then compare and contrast different products. Principal Component Analysis (PCA) is used to reduce the complexity of making comparisons. With dozens of compounds in whiskies, the comparative analysis would be impossible to understand. The PCA use a best-fit approach to create axes that a synthesis of multiple compounds, as shown below.

Each colour identifies a different whisky, each of which was sampled multiple times. As a broad overview, there are two main clumps of whisky brands (labelled as Groups 1 and 2 above) and then a small number of outliers. The first principal component (PC1) most notably accounts for the difference between the two main groups, and this dimension comprises compounds including furfural (woody, bready, nutty), hexanoic acid‚ ethyl ester (sweet, pineapple, fruity flavour) and acetic acid (pungent, sour, overripe fruit). Furthermore, within Group 1, PC1 is the main differentiating factor. This group includes six single malts – mostly Highland and Speyside – and one blend.
In contrast, within Group 2, the main differentiating dimension is PC3, which combines compounds such as propanoic acid‚ 2-hydroxy-‚ ethyl ester (fruity, creamy, pineapple-like), phenylethyl alcohol (floral, rose, bready) and 1-butanol‚ 3-methyl- (fruity, banana, ethereal). This group includes 18 single malts and five blends. The most notable outlier of all is the whisky that is differentiated in the PC2 dimension (at the top of chart, marked in brown), which is defined by a single compound: d-methionine (an amino acid). This product is Ledaig 10 Year Old, an Island whisky from Tobermory in Scotland. This amino acid is sometimes described as having an old potato smell, and reviews of the whisky mention seaside and waxy aromas.
Kavalan, from Taiwan, also stands out in the PCA plot as an outlier, at the extreme left of the PC1 dimension. Other distinct products are the Jura 10 Year Old and Ardbeg 10 Year Old, Island and Islay single malts respectively. The final outlier is a blend: Nomad Outland. This is notable as a blend of malts from Scotland, but matured between both Scotland and Spain.
Focusing further on blended whisky, using this sample method, it is possible to identify similarities between these and single malts. This can be useful in assessing how successful producers are at mimicking the characteristics of more expensive single malts through blending. The one blend in Group 1 is from Australia, and is clustered with Speyburn and Highland Park products.

Within Group 2, two of the blends are from different distilleries in Japan, but which share much commonality. Furthermore, these Japanese blends are also similar to blends from Great Britain and a Scottish/US mix – and all of which share similarities with a Lagavulin product from Scotland. Perhaps there is a tendency towards similarity between blends as the different single malt components – put loosely – average themselves out. The chart above shows how the blends (in blue) cluster relative to the single malts (in red).
The next stage in this project is to expand the dataset further, to hundreds of whiskies, to reveal patterns and correlations reflecting geographies, maturation process, ageing and other factors. In early 2022, Oxford Indices will launch a research database that will show the individual compounds detected and their relative concentrations. Characterising the market of whiskies to this level detail presents many opportunities, from engineering new products to protecting the value in an important and high-value sector.